APPLICATIONS
- We calculate accurate drug concentration profiles in tissue and plasma
- Analysis of these profiles permits the user to eliminate lead compound candidates which exhibit undesirable pharmacokinetic parameters, which would make them unsuitable for human trials.
- However, should the therapeutic effect of this candidate exceed the cost of additional chemical modification, and merit further chemical optimization, our models are used to assess the new pharmacokinetic behaviour of the modified compound.
Such elimination of non-viable compounds serves to accelerate and validate the identification of drug candidates and in turn to eliminate the costs associated with unnecessary experimentation and studies.
We therefore work in close collaboration with our clients, to ensure that our models are tailored exactly to suit the research and development methods for their specific projects.
CALCULATED DATA
We provide our clients with the full set of data which we calculate according to the scope of work or specifications for multiple compounds. Pharmacological characteristics of the compounds are requested by us and are provided by the clients.
For the defined ADME methods and rates of clearance we may also perform multiple analytical activities with the calculated data, such as biologic half-life, area under the curve, bioavailability etc., in selected compounds. We provide clients with various forms of graphical representations of the data, comparative diagrams, risk analysis, trends and range variances in values, calculating border values for certain parameters and dosing patterns, and make adjustments for subsequent series of experiments.
As an example, we provide three screen captures with basic graphical representations of calculated data. The data were calculated for oral drug administration (200 mg); first-pass effect (50%) was simulated, renal and hepatic extraction ratio with values 0.2 and 0.0005 correspondingly were counted. Drug dynamic concentrations in the body of a male with total weight of 70 kg were calculated.
Graph 1.Dynamics of concentration of a compound in the heart (click to enlarge).
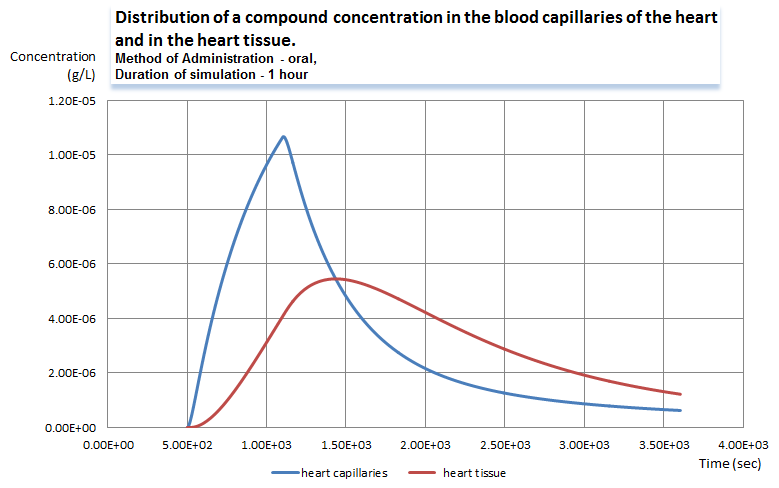
The first graph represents the dynamics of the drug concentration in the plasma of the heart capillaries as well as in the heart tissue. The graph series represent the changes in the concentrations within one hour after the first dose of the compound was injected. The blue line shows fast growth of the concentration right after the drug was administered and distributed among tissue capillaries of multiple compartments. Then, as the compound is diffusing to the tissues, the concentration in the capillary goes down and drops below the level of the compound in the tissue. After the lines cross the compound exchange flow goes in the reversed direction.
Graph 2. Dynamics of concentration of a compound in multiple compartments (click to enlarge).
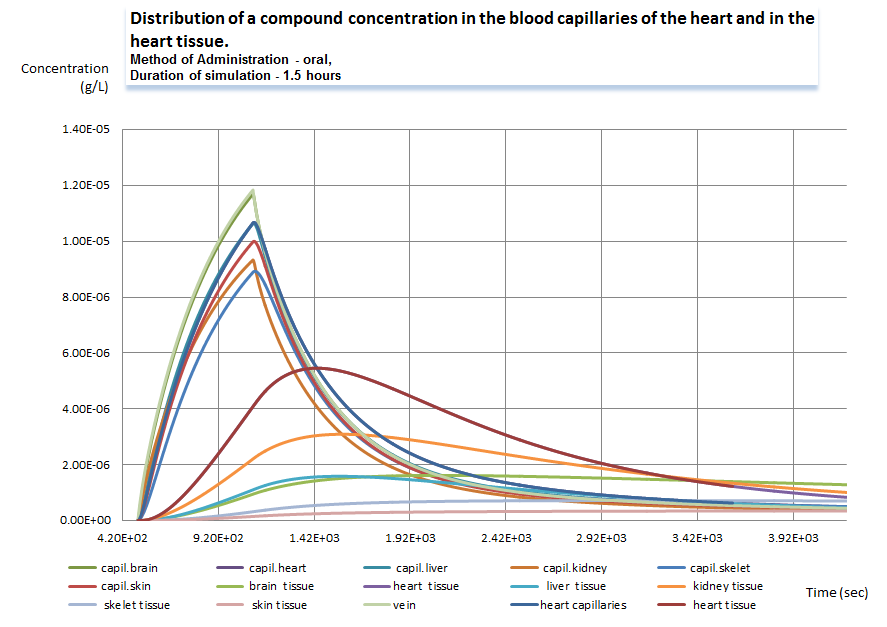
The second graph is similar to the first one, it was built on the same results of calculations for multiple tissue compartments. The highest is the compound exchange rate. The difference between the “pairs” of series depends on multiple parameters: the amount of the compound in the capillaries, the surface of the diffusion, diffusion coefficient, solubility, drug carrier characteristics etc.
Graph 3.Dynamics of concentration of a compound in several compartments for 25 hours period (click to enlarge).
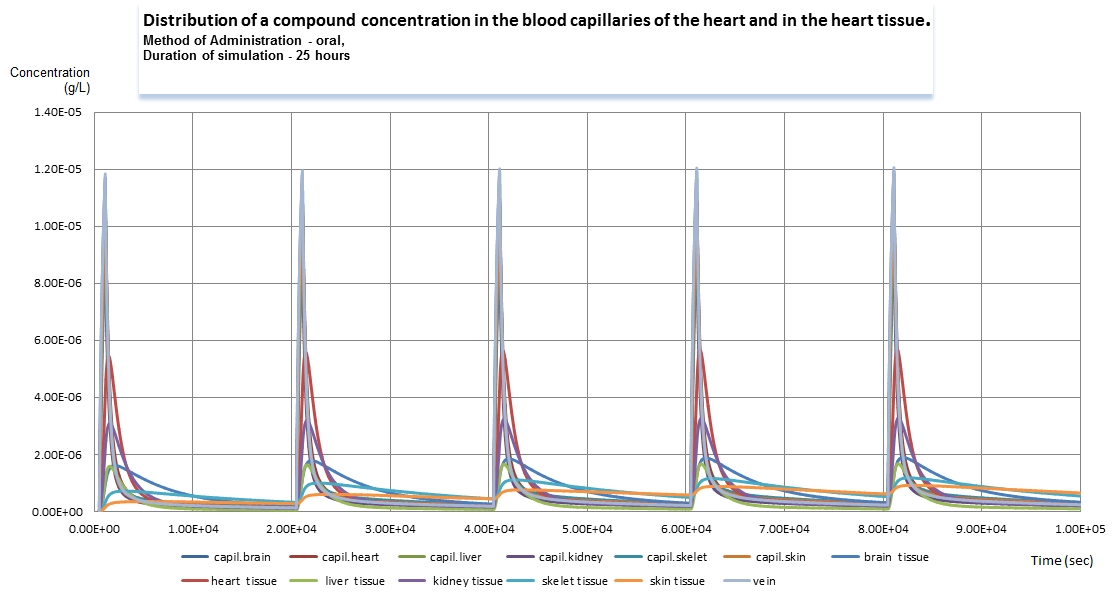
We calculate the data for various time lines and dosage regimen. The third graph represents the dynamics for a period of time of 25 hours. Drug administration was performed 5 times; the peaks of the series on the graph show the approximate time when they were made. The calculations we provide may extend as far as weeks and months. Some tissues demonstrate that the compound is accumulated in them; the summarized clearance ratio is not high enough to clean it from those tissues during 5 hours.


Comments are closed.